
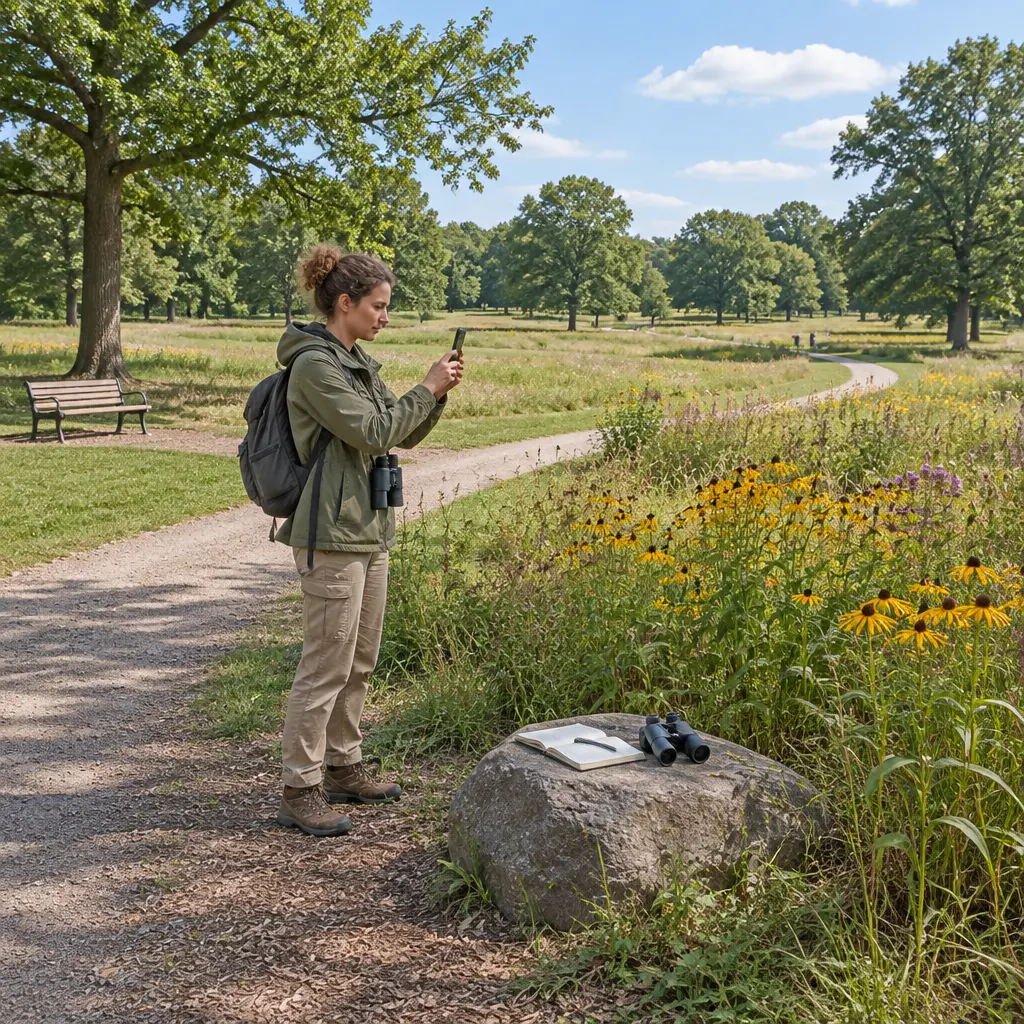
Citizen-science mapping apps are mobile and web tools that let members of the public record observations tied to places, then share those records for research, planning, or public use. Apps such as iNaturalist, eBird, and EpiCollect turn everyday phone users into distributed data collectors: people contribute observations, photographs, measurements, or reports, while platforms and researchers organize and analyze them. Their reach is substantial—eBird reported more than 100 million bird observations in 2023, while iNaturalist users recorded millions of observations annually—yet the value of these maps depends on data quality, participant representation, privacy protections, and clear governance. Understanding how these apps collect data, validate it, and use it helps citizens and institutions make better decisions about the maps they create.
Citizen-science mapping apps as participatory data infrastructure
A citizen-science mapping app is a digital system through which non-specialists submit geographically referenced observations that can contribute to scientific or civic knowledge. The National Academies of Sciences, Engineering, and Medicine describes citizen science as public participation in scientific research, including activities such as collecting and interpreting data. In mapping apps, the defining attribute is the link between a record and a location: a bird sighting, invasive-plant report, air-quality reading, or infrastructure complaint becomes mappable evidence.
These platforms are a form of participatory sensing, a term used in research on how people and their devices collectively measure real-world conditions. Typical records combine coordinates, time, a category or measurement, and sometimes a photograph or audio clip. The combination can reveal patterns at scales that are difficult for a small research team to cover, but the resulting dataset is not automatically representative of all places or people.
Crowdsourced observation maps
Crowdsourced observation maps aggregate reports submitted by many users. On iNaturalist, participants upload observations of organisms, often with images and location information; community members and automated suggestions can help identify species. The platform’s annual reporting has documented tens of millions of observations in recent years, illustrating how a large volunteer network can produce extensive biodiversity records. eBird, operated by the Cornell Lab of Ornithology, similarly collects bird checklists and locations; its 2023 annual report described a global database containing more than 100 million bird observations for that year.
These figures demonstrate volume, not uniform coverage. Observations tend to cluster around populated areas, roads, parks, and places that participants visit. Researchers therefore use methods such as effort tracking, statistical weighting, and targeted sampling to distinguish ecological patterns from patterns in human activity.
Structured field-data and civic-reporting apps
Structured field-data apps guide participants through standardized forms, which can improve consistency across observations. EpiCollect, developed by researchers at Imperial College London, is an example of a configurable platform for collecting location-linked field data. Civic reporting tools use a related model: residents submit mapped reports about issues such as potholes, broken streetlights, or waste, which public agencies can route to relevant departments. In both cases, a form’s required fields and categories shape what becomes visible in the resulting dataset.
The distinction between scientific observation and service request matters. A civic report may be designed to trigger operational follow-up, whereas a research observation may be retained for analysis. Apps should make the intended use, responsible organization, and likely response explicit so that contributors understand what their submission can—and cannot—accomplish.
Data quality in citizen mapping apps
Data quality is the degree to which records are fit for a stated purpose, considering factors such as accuracy, completeness, consistency, and timeliness. The Federal Geographic Data Committee’s geospatial metadata standards emphasize documenting a dataset’s lineage, methods, and limitations; the same principle applies to volunteer-generated maps. A large number of points does not, by itself, establish that a map is accurate or suitable for policy decisions.
Mapping platforms commonly combine standardized submission forms, location and time stamps, automated checks, expert review, and community feedback. These mechanisms address different error types. A GPS coordinate can be precise while the species identification is wrong, and a correct observation can still be misleading if the sampling effort is unknown.
Validation through community and expert review
Validation is the process of checking whether a record is plausible and sufficiently supported. iNaturalist’s community-identification system allows users to compare identifications and reach a community-supported level of identification when observations meet platform criteria. eBird applies filters and review processes to flag unusual reports for additional scrutiny. Such systems can improve reliability, but they do not make every record error-free; expert review and transparent uncertainty remain important, especially for rare or consequential observations.
For a map of invasive species, for example, a photo can help reviewers verify a report before managers act. For health or hazard reporting, an app may need stricter protocols, clearly defined categories, and an escalation path because a mistaken report could divert limited resources.
Sampling bias and geographic coverage
Sampling bias occurs when submitted observations systematically differ from the population or landscape a study aims to describe. Citizen mapping often overrepresents people with smartphones, reliable connectivity, free time, and access to attractive or easily reached locations. The U.S. Census Bureau’s American Community Survey documents persistent differences in broadband access by geography and household characteristics, underscoring that an app-only collection method can exclude some communities.
Researchers can reduce—but not eliminate—this bias by comparing app records with systematic surveys, recording observation effort, recruiting underrepresented groups, and offering offline or non-digital participation. Maps should also show where data are missing rather than implying that a blank area has no relevant species, hazards, or needs.
Privacy and governance of location data
Location privacy is the protection of information that can reveal where a person, household, or sensitive resource is situated. A mapped observation can expose more than its subject: repeated submissions may reveal a contributor’s routines, while precise coordinates can identify a private residence or a vulnerable wildlife site. The National Institute of Standards and Technology’s Privacy Framework treats privacy as a risk-management issue across the full data lifecycle, from collection through retention and sharing.
Good governance establishes who controls the data, why it is collected, who can access it, how long it is retained, and how contributors can withdraw or correct submissions. The European Union’s General Data Protection Regulation provides a prominent legal framework for processing personal data, including requirements around lawful basis, transparency, and individual rights where applicable. Legal duties vary by jurisdiction, so app operators should not treat a general consent screen as a substitute for clear, specific explanations.
Coordinate protection and sensitive observations
Coordinate protection means reducing location precision or restricting access when exact positions could create harm. Biodiversity platforms may obscure records for threatened species or private property; public-health and civic apps may need to avoid displaying identifiable household-level reports. Designers can use location blurring, access controls, aggregation, and delayed publication, while retaining appropriate precision for authorized analysis.
Protection involves trade-offs: overly coarse coordinates can make a dataset less useful for conservation or service delivery, while unrestricted precision may put people or species at risk. Platforms should explain these choices and apply stronger safeguards where the consequences of disclosure are greater.
Consent, ownership, and public benefit
Meaningful consent tells participants what is collected, how it will be used, whether it will be shared, and whether a submission can be removed. Data ownership and licensing also matter: open licenses can enable reuse, but contributors should understand that open data may be copied and redistributed beyond the original app. The Global Biodiversity Information Facility, which aggregates biodiversity data from many providers, illustrates the research value of shared records while also making source documentation and licensing essential.
Public benefit is strongest when contributors can see what their effort achieved. Agencies and research teams can publish summaries, acknowledge community partners, and report how submissions influenced decisions. This feedback loop supports trust and helps distinguish genuine collaboration from one-way extraction of unpaid labor.
Real-world uses and limits of mapped citizen data
Citizen-generated maps can support ecological monitoring, environmental justice, public-health surveillance, and local service planning. Their advantage is distributed reach: a network of observers can report changing conditions more frequently than a small centralized team. Their limitation is that observation records often indicate where people looked or chose to report, not necessarily where a condition is absent or most severe.
Biodiversity monitoring with iNaturalist and eBird
Biodiversity platforms turn photographs, checklists, and species identifications into records that scientists can use to examine distributions and seasonal change. eBird’s large, time-stamped checklist archive supports analyses of bird abundance and movement, while iNaturalist observations can document organisms across regions and contribute records to biodiversity data aggregators. Their scale is valuable, but researchers must account for observer effort, expertise, accessibility, and differences in reporting behavior before drawing conclusions.
A useful figure for an article on this topic would be a line chart comparing annual observations on a major platform with the number of participating contributors. Pairing volume with contributor counts would show growth while avoiding the implication that more records necessarily mean more complete coverage.
Community science for environmental health
Community environmental monitoring uses residents’ observations or low-cost sensors to document conditions such as air pollution, heat, or water quality. The U.S. Environmental Protection Agency’s guidance on air-sensor use stresses that lower-cost sensors can help identify local patterns but may not match regulatory-grade monitors without appropriate evaluation and interpretation. A mapped sensor reading should therefore include device type, calibration information, time, and uncertainty rather than appearing as an unquestioned measurement.
When paired with agency monitoring and community knowledge, these maps can help identify questions for follow-up and make local disparities easier to investigate. They should not be presented as definitive proof of exposure or health impact unless the measurement design supports that conclusion.
Civic issue reporting and government response
Civic reporting apps convert residents’ observations into geographically organized requests or evidence for municipal services. A map of repeated streetlight failures or flooding reports can help departments prioritize inspections, but report counts can reflect awareness and access to the app as much as the underlying problem. Agencies can improve interpretation by publishing response status, combining app reports with inspections, and offering phone, web, and in-person reporting alternatives.
A useful accompanying chart would compare reports received, cases verified, and cases resolved by neighborhood. Showing all three measures can reveal both service outcomes and gaps in reporting or verification.
Design principles for responsible mapping apps
Responsible design treats participants as collaborators and data quality, inclusion, and privacy as connected requirements. An app should explain its purpose in plain language, minimize unnecessary collection, provide accessible submission options, and document how records are checked and used. These principles help ensure that a map represents not only what the platform can collect, but also what communities need it to show.
- State the intended use and limits of the data before submission.
- Collect only the location and personal information needed for that purpose.
- Record methods, uncertainty, observation effort, and data provenance.
- Offer accessible interfaces and non-app alternatives for participation.
- Provide feedback about validation, decisions, and outcomes.
- Protect sensitive coordinates and establish retention and deletion rules.
Together, these practices make mapped citizen data more useful and more accountable. They also shift the central question from how many observations an app can gather to whether those observations are trustworthy, fairly collected, safely managed, and acted upon.
Conclusion: citizen mapping apps need trust as well as scale
Citizen-science mapping apps connect people’s observations to place, creating large datasets for biodiversity research, environmental monitoring, and civic services. Their scale is demonstrated by platforms such as eBird and iNaturalist, but volume alone cannot guarantee representative coverage or reliable conclusions. Data validation, bias assessment, location privacy, transparent consent, and visible public benefit are equally important attributes of responsible mapping.
Readers evaluating or building these tools should ask who is represented, how observations are checked, what location details are exposed, and what happens after a submission. Further reading from the National Academies, the Federal Geographic Data Committee, NIST, and the platforms’ own documentation can help communities and institutions design projects that treat contributors as partners rather than simply as sources of data.
Sources: National Academies of Sciences, Engineering, and Medicine, Learning Through Citizen Science: Enhancing Opportunities by Design, https://nap.nationalacademies.org/catalog/25183/learning-through-citizen-science-enhancing-opportunities-by-design; Cornell Lab of Ornithology, eBird 2023 Annual Report, https://ebird.org/news/2023-year-in-review; iNaturalist, About iNaturalist, https://www.inaturalist.org/pages/about; Imperial College London, EpiCollect, https://www.epicollect.net/; Federal Geographic Data Committee, Geospatial Metadata Standards, https://www.fgdc.gov/metadata; U.S. Census Bureau, American Community Survey, https://www.census.gov/programs-surveys/acs; National Institute of Standards and Technology, NIST Privacy Framework, https://www.nist.gov/privacy-framework; European Union, General Data Protection Regulation, https://eur-lex.europa.eu/eli/reg/2016/679/oj; Global Biodiversity Information Facility, What is GBIF?, https://www.gbif.org/what-is-gbif; U.S. Environmental Protection Agency, Air Sensor Guidebook, https://www.epa.gov/air-sensor-toolbox/air-sensor-guidebook.